Features
Upstanding Markowitz


Sharpe, then a Ph.D. candidate at the University of California, Los Angeles, needed a doctoral dissertation topic. He had read “Portfolio Selection,” Markowitz’s seminal work on risk and return—first published in 1952 and updated in 1959—that presented a so-called efficient frontier of optimal investment. While advocating a diversified portfolio to reduce risk, Markowitz stopped short of developing a practical means to assess how various holdings operate together, or correlate, though the question had occurred to him.
Sharpe accepted Markowitz’s suggestion that he investigate Portfolio Theory as a thesis project. By connecting a portfolio to a single risk factor, he greatly simplified Markowitz’s work. Sharpe has committed himself ever since to making finance more accessible to both professionals and individuals.
In 1990, Harry Markowitz, William Sharpe, and Merton Miller jointly received the Nobel Prize in Economic Sciences for their profound contributions to the field of financial economics.
Source: https://www.nobelprize.org/prizes/economic-sciences/1990/press-release/
Harry Markowitz’s concepts of “mean-variance analysis” simplified the complex task of constructing diversified portfolios and introduction of the “Efficient Frontier” is a seminal contribution to the field of modern portfolio theory. Developed in the 1950s, this groundbreaking theory fundamentally changed the way we approach investment to optimize returns while minimizing risk.
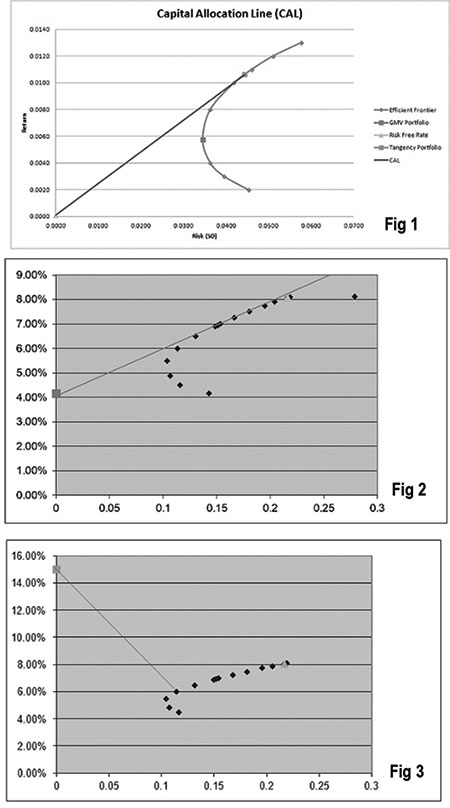
The Efficient Frontier is a graphical representation of the relationship between risk and return for a given set of company shares, called a portfolio. In simple terms, it is a way of visualizing how to build an investment portfolio that provides the highest expected return for a given level of risk, or conversely, the lowest risk for a given expected return. The central idea is to achieve the best possible risk-return trade-off, a concept that is at the core of portfolio management. The capital allocation line (CAL) represents the trade-off between the risk and expected return of a portfolio.
The x-axis on the CAL typically represents the standard deviation (volatility) of the portfolio, which is a measure of its risk. On the y-axis, you would find the expected return of the portfolio. The CAL visually illustrates how portfolios with different combinations of risky and risk-free assets can achieve various risk-return profiles. In a typical graph, the Capital Allocation Line (CAL) usually takes an upward trajectory. This is because the risk-free return, which is considered the lowest return available in any financial market, occupies the lowest point on the y-axis where the x-axis intersects at zero, representing the risk-free rate (as illustrated in Figure 1).

Source: https://thefinancialintern.wordpress.com/2012/07/29/modern-portfolio-theory-creating-the-capital-allocation-line/
The efficient drawn for a portfolio in stock market in New Zealand and Australia in 2018 are provided in Figure 2.
Figure 2: efficient Frontier and the CAL for five shares in NZX and ASX
During my MBA class, students must construct efficient frontiers using a portfolio of shares from the Colombo Stock Exchange (CSE) in one of the assignments. The efficient frontier and the CAL drawn by the students resulted in a graph.
Figure 3:
CAL in Colombo Stock Market (Upstanding the CAL in Sri Lanka)
They asked, “Sir, can the Capital Allocation Line (CAL) intersect with the efficient frontier?” I playfully replied, “Well, in Sri Lanka, anything is possible.”
It’s a rare and unlikely situation for assets considered risk-free, such as three-month government treasury bills, to offer higher returns than riskier assets.
Why doesn’t everyone use the Markowitz model to solve their investment problems? The answer again lies in the statistics. The historical mean return may be a poor estimate of the future mean return. As you increase the number of securities, you increase the number of correlations you must estimate — and you must estimate them correctly to obtain the right answer.
Criticisms of the Efficient Frontier
The efficient frontier and modern portfolio theory have many assumptions that may not properly represent reality. For example, one of the assumptions is that asset returns follow a normal distribution.4
In reality, securities may experience returns (also known as tail risk) that are more than three standard deviations away from the mean. Consequently, asset returns are said to follow a leptokurtic distribution or heavy-tailed distribution.
Additionally, Markowitz posits several assumptions in his theory, such as that investors are rational and avoid risk when possible, that there are not enough investors to influence market prices, and that investors have unlimited access to borrowing and lending money at the risk-free interest rate.4
However, reality proves that the market includes irrational and risk-seeking investors, there are large market participants who could influence market prices, and there are investors who do not have unlimited access to borrowing and lending money.
For the benefit of the investors reading this column, I’m going to share a few portfolios constructed from the shares of CSE, each containing five shares in this column in coming weeks. I will also include their financial data and historical returns spanning a decade. Furthermore, I hope to present the efficient frontiers for 10 different combinations (proportions) for each portfolio and pinpointed the best one using the Sharpe Ratio.
(The writer, a senior Chartered Accountant and professional banker, is Professor at SLIIT University, Malabe. He is also the author of the “Doing Social Research and Publishing Results”, a Springer publication (Singapore), and “Samaja Gaveshakaya (in Sinhala). The views and opinions expressed in this article are solely those of the author and do not necessarily reflect the official policy or position of the institution he works for.)