Features
The Salinity Barrier and Nilwala Floods: Clearing up Misconceptions

by Dr. R. Galappatti,
Chairman, Lanka Hydraulic Institute (LHI).
Introduction
Recent experience of high water levels in lower reaches of the Nilwala Ganga has been attributed by various parties to the construction of the Salinity Barrier in 2018-2022, 5.4 km upstream of the sea outfall. While it is understandable that the affected communities would blame the most recent construction in the river channel for this, many technically qualified persons have also subscribed to this view without either examining hydraulic computations or making any measurements at the barrier. We are concerned that ill-considered attempts are being made to interfere with the structural integrity of the barrier and endanger a major piece of water supply infrastructure.
The salinity barrier is designed to protect the water supply intakes from salinity intrusion and ensure an uninterrupted supply of drinking water to around 600,000 consumers by the year 2035, in the Matara and Hambantota districts, under the Matara Stage IV Water Supply Project of the National Water Supply & Drainage Board (NWSDB). The conceptual design of the barrier including its dimensions, levels and operating rules was carried out by Lanka Hydraulic Institute (LHI).
Regular review meetings were held at regional level by the NWSDB with participation of the Irrigation Department. The Central Engineering Consultancy Bureau (CECB), the EIA consultant, also participated, with full access to the details of the ongoing work at all stages of the study. Modifications were made to the study approach and the designs as required.
The hydraulic studies including design calculations were carried out and the main parameters of the barrier were determined and verified using physical and numerical model studies. This focused on the salinity barrier, particularly its flood impacts, and led to a positive EIA report after public consultations were completed. Detailed designs and construction of the barrier was carried out by a Korean Company (Kolon Samsung C&T) with Ceywater as the local design partner under a Design-Build contract.
The Salinity Barrier
The final design consists of providing a 5-bay gated type structure with vertical lifting gates and piers across the inner stream section 5.4 km upstream of the sea mouth, in the river reach between Thudawa Pump station and Navimana ferry crossing. The gates are 10m wide and 3.1m high with the gate sill fixed at –2.5 m MSL. Gate top at closed position is at +0.6 m MSL and the gate bottom in fully open position is to be at 5m MSL during high and normal flow conditions. This level is above the High Flood Level, as the top level of the flood bund is only around 4.3 m MSL.
Three of the five gates were to be made of two separate sections to allow the upper section to be lowered independently, to make it possible to lower the upstream pool level when necessary for irrigation water management at the request of the Irrigation Department. Sheet-pile cut-off walls were provided across the low-lying areas of the flood plain on either bank to prevent saline water bypassing the main structure during operation and to ensure that during dry weather the river flow is confined to the inner channel and not to overflow into the floodplain. In addition to these main features, gate operating structures, cut-off walls, access roads etc. were included in the design.
The barrier is in full conformity to the stipulations in the MOU signed between NWSDB and the Irrigation Department in March 2017, and the Irrigation Department granted approval for the NWSDB to implement the project.
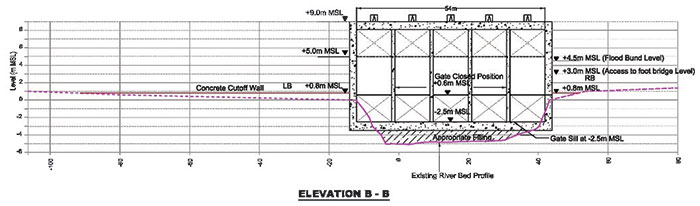
Figure 2: Salinity Barrier across Nilwala River
Impacts of the Salinity Barrier
The increase in river water level during floods, and operating conditions and concerns of the stakeholders due the proposed structure, were the main considerations in determining optimal values for gate openings, gate sill levels and other parameters for the design.
The upstream flooding impact of the barrier design was computed using a numerical model and verified by carrying out a series of physical model tests at Lanka Hydraulic Institute (LHI). These were used to verify that the flow pattern around and downstream of the gated structure was satisfactory.
The water levels in the upstream river reach, with and without the barrier, were estimated for different flow conditions including floods up to 100 yr return period. The estimated anticipated water level rise just upstream of the Salinity Barrier was about 1 cm maximum during floods of 100 yr return period. There was a higher (4-7 cm) relative water level rise during bank full and low return period floods.
Backwater propagation lengths have been calculated and these anticipated water level rises were considered acceptable. It is relevant to note that, the acceptable head loss at the planned Kelani Ganga salinity barrier was fixed in the range 5 cm to 6 cm for a 100 yr flood.
As far as the flood impact of the cut-off wall is concerned, the impact will be negligible because this wall, with a top level of only 0.8 m MSL, will be well and truly submerged during a major flood. Further there is an allegation that debris might trap buildup from the river bed level to the sill level of gates, and exacerbate flooding. Even if debris are accumulated, its total hydraulic impact is still negligible. Further, fresh bathymetric survey conducted in Dec 2023 has even revealed that there is in fact no debris accreted upstream of the gate structure.
Long inundation period during present flood compared to previous floods
While it has been demonstrated that construction of the Salinity Barrier is not the cause of recent floods, it is nevertheless necessary to investigate why this long inundation of paddy lands occurred and determine what actions need to be taken to prevent or reduce the probability of a recurrence.
In this context it is necessary to examine what happened in May 2017 when there was an extreme flood event in this basin. The flood was caused by an extreme rainfall event of about three days duration that caused a sharp flood peak reaching a daily average water level of 4.32 m MSL at Thalagahagoda on the very next day. The water levels receded to normal levels within the next ten days while it took seven days to decrease to flood alert level (1.4 m MSL) at Thalagahagoda. The return period of this flood is said to be between 75 and 100 yr.
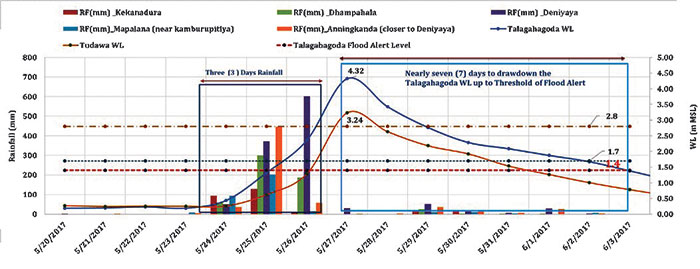
Figure 4: Rainfall Pattern and Drawdown of Water Levels during 2017 Flood
The duration of the long series of rainfall events that spread out over more than two months from Mid-September to end November 2023 is markedly different – both from the point of view of the basin and the time of the year when it took place. While the water level at Thalagahagoda peaked only at 2.92 m MSL in 2023, the level continued to stay above 1.7 m MSL (Minor flood level) for almost the entire period (Oct to mid of Nov).
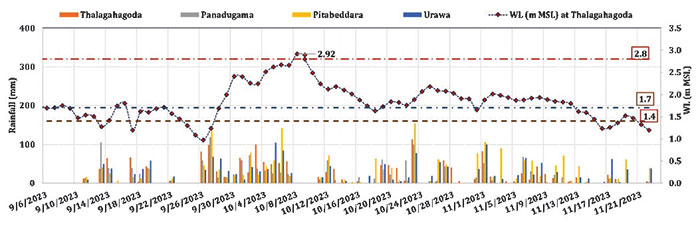
Figure 3: Rainfall Pattern and Drawdown of Water Levels during Sep Oct 2023 Flood (06th Sep – 22nd Nov 2023)
The markedly different nature of this flood – including its extremely slow recession could only be explained by considering the retention (storage) of flood water on the flood plain which is divided into two on either side of the Nilwala flood bund. The area adjacent to the river will drain slowly into the river channel in the normal manner. The water collecting in the “protected area” must be pumped out at a few pumping stations located along the flood bund.
Duration of operation of these pumps is on record but their pumping rate is not known. An additional point to be considered is that the measured water level profile on the short river reach downstream of the barrier show a steeper slope indicating a more constricted channel from the railway bridge to the sea.
It is also important to note that the rainfall pattern in 2023 is unusual and unexpected, and that no usual rainfall runoff model could accurately interpret it. The models, in turn, must be more detailed, to include the flood plain storage and pumping rates to represent the flood routing performance of the system under such unusual rainfall patterns which might be a trend caused by climate change.
It must also be borne in mind that the Nilwala basin is not a stranger to flooding, though not so late in the year. The steep upper basin that descends suddenly into a largely flat coastal plain is characteristic of all large wet zone rivers in Sri Lanka.
Conclusions
The long-duration flooding experience in the Nilwala basin in 2023 has not been caused by the construction of the Salinity Barrier.A more detailed representation of the flood plains and pump operation is needed to quantify accurately the long recession of the flood plain
The marked change in rainfall patterns might be due to a climate change effect and this type of effect might also impact other river basins in the wet zone. This requires attention.
The ill- considered removal of the low cut-off wall across the lower floodplain should be restored to avoid possible shut down of water supply intakes in the next dry season.