Features
How to pick relatively better performing shares based on historical data?


Investors are constantly seeking ways to assess the performance of their investments while considering the level of risk they’re exposed to. This is where the Sharpe ratio comes into play. In this article, we will delve into what the Sharpe ratio is, its formula, and provide some practical examples to help you grasp its significance.
As discussed before, among the Nobel laureates in finance, William F. Sharpe stands out for introducing the Sharpe ratio in 1966, later formalized in 1975. This ratio, akin to Markovitz’s mean-variance analysis and Merton Howard Miller’s Modigliani–Miller theorem, contributed to their joint recognition with the 1990 Nobel Prize. The Sharpe ratio assesses risk-adjusted returns, a crucial consideration for investors.
The Sharpe ratio, expressed as (Rp – Rf) /
σp, evaluates the excess return of a portfolio (Rp) over the risk-free rate (Rf) divided by the standard deviation (σp) of the portfolio’s excess return. This calculation illuminates whether excess returns result from skilled investments or are mere products of luck and risk. A higher Sharpe ratio signals a more attractive risk-adjusted return.
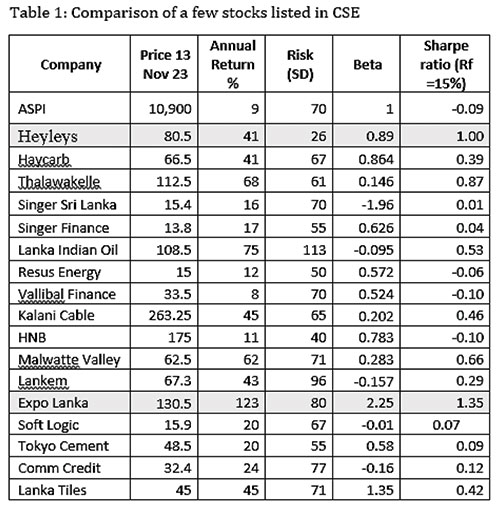
While primarily designed for portfolios, the Sharpe ratio can offer insights into individual stock performance as well, why not?. For simplicity, let’s explore approximate Sharpe ratios for selected individual stocks in the CSE, providing investors with a tool for comparing risk-adjusted performance of those stocks.
It is crucial to underscore that, while the Sharpe ratio is a valuable tool, it is not without limitations. Foremost among these limitations is its reliance on historical data, and as we are well aware, history does not consistently replicate itself. Secondly, investment managers can manipulate ratios by selectively choosing measurement intervals, introducing the potential for distorting the history of risk-adjusted returns. Furthermore, the assumption of a normal distribution in standard deviation calculations may not consistently align with the actual behaviours observed in financial markets.
Acknowledging the constraints of this metric, a Sharpe ratio surpassing 1 is commonly deemed favourable, signifying that an investment provides returns in excess of the associated risks. However, interpretation depends on context, often involving comparisons with peers or market sectors. For instance, as of June 30, 2023, the S&P 500 Portfolio Sharpe ratio stands at 0.88, providing a benchmark for assessing risk-adjusted performance.

In conclusion, understanding how to pick relatively better-performing shares based on historical data involves leveraging the Sharpe ratio. While it provides valuable insights, investors must be aware of its limitations and consider its application to individual stocks cautiously. As financial markets evolve, the Sharpe ratio remains a relevant tool, but its use should be complemented by a broader understanding of predictive measures and market dynamics.
The statistics presented here are derived from a simple Excel-based analysis of monthly data spanning at least five years, sourced from reputable financial platforms such as www.investing.com and/or www.yahoofinance.com (Table 1). Interestingly, while daily prices are readily available on these websites, free of charge, accessing these data from the CSE (and similar exchanges worldwide, for example NZX) often requires a subscription fee. This disparity underscores the accessibility challenges faced by investors in obtaining comprehensive historical stock prices.
Notably, all figures provided have been rounded to the nearest whole number, with the exception of Beta values. In financial terms, Beta signifies the correlation between the return of a specific stock and the overall market return, gauged through price changes. For the sake of simplicity, our analysis focuses solely on capital gains or losses, omitting considerations for other returns such as dividends, rights, and bonus issues. This refined approach aims to offer a clear and streamlined perspective on the performance dynamics of the selected stocks.
(The writer, a senior Chartered Accountant and professional banker, is Professor at SLIIT University, Malabe. He is also the author of the “Doing Social Research and Publishing Results”, a Springer publication (Singapore), and “Samaja Gaveshakaya (in Sinhala). The views and opinions expressed in this article are solely those of the author and do not necessarily reflect the official policy or position of the institution he works for.)